PCIe Non Transparent Bridge (NTB):NTB可支援容錯移轉
看了半天還是搞不懂 透明橋(TB),非透明橋(NTB) 這兩種方式的意思.
downstream upstream
PCI-E 太好用,所以很多介面就直接從 PCI-E 接下來,如 SATA 3.2 (mSATA & M2) ,傳統兩台具有備援機制 (redundant) 的裝置(通常是儲存裝置 Storage) 會透過 ethernet 或是 infiniband 的介面來溝通.
透明橋(TB)
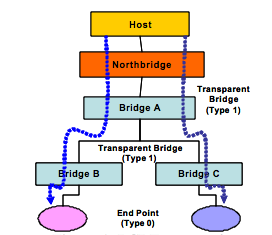
How the Transparent Bridge Works
The transparent bridge provides electrical isolation between PCI busses. The host enumerates the system through discovery of bridges and end devices. For transparent bridges (TB), the Configuration Status Register (CSR) with a “Type 1” header informs the processor to keep enumerating beyond this bridge as additional devices lie downstream (as illustrated in Bridge A, B and C in Figure 1).
These Bridges with Type 1 headers include CSR registers for primary, secondary and subordinate bus numbers, which, when programmed by the host, define the CSR addresses of all downstream devices.
Endpoint devices have a “Type 0” header in their CSRs to inform the enumerator (BIOS or processor) that no additional devices lie downstream. These CSRs include base address registers (BARs) used to request memory and I/O apertures from the host.
圖片出自於 NTB_Brief_April-05.pdf
![TB]()
透明網橋提供了PCI總線之間的電氣隔離。主機通過發現橋樑和終端設備枚舉系統。對於透明網橋(TB),配置狀態寄存器(CSR)與“1型”頭通知處理器保持列舉超出此橋為其他設備說謊下游(如圖1所示橋A,B和C)。
這些橋樑與1型頭包括CSR寄存器為初級,中級和下級總線號,當主機編程,定義所有下游設備的企業社會責任的地址。
端點設備在他們的CSR“類型0”頭通知枚舉(BIOS或處理器),沒有額外的設備所在的下游。這些客戶服務代表包括基地址寄存器(BAR)用來從主機請求內存和I / O光圈。
非透明橋(NTB)
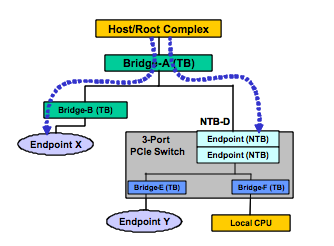
How the NTB Works
In addition to the electrical isolation the NTB adds logical isolation by providing processor domain partitioning and address translation between the memory-mapped spaces of these domains.
With the NTB, devices on either side of the bridge are not visible from the other side, but a path is provided for data transfer and status exchange between the processor domains.
In this example a system host will enumerate through Bridges A and B (both transparent) on the left branch of the figure 2 until it reaches the endpoint X.
On the right side branch, the host will stop enumeration at Bridge D (NTBD).
Similarly, the local CPU will enumerate through Bridge E and F (both virtual bridges within the switch) and discover the endpoint Y, but will not attempt to discover elements beyond Bridge D. This will result in two memory domains.
圖片出自於 NTB_Brief_April-05.pdf
![NTB]()
除了電隔離NTB通過提供處理器域劃分和地址轉換這些域的存儲器映射空間之間增加了邏輯隔離。
與NTB,在橋的兩邊裝置不從對方可見,但路徑被提供用於在處理器域之間傳送數據和狀態交換。
在本實施例的系統的主機將通過橋接A和B(兩者透明),直到它到達終點十列舉在圖2的左分支
在右側的分支,主機將停止枚舉在橋D(NTBD)。
同樣,本地CPU將通過大橋E和F枚舉(開關內兩個虛擬橋接),並發現端點Y,但不會嘗試發現超出大橋D.元素這將導致兩個內存域。
That white paper described the different address
domains existing in the Root Processor and the Endpoint Processor, memory map management, enumeration
and initialization, peer-to-peer communication mechanisms, interrupt and error reporting, and possible
redundant topologies. Since the release of the white paper, IDT has designed and implemented a multipeer
system using the x86 based system as the Root Processor (RP) and Endpoint Processor (EP)
connecting through IDT’s PES24NT3 NTB port and IDT’s PES64H16 device as the multi-port PCIe® switch
for the System Interconnect.
Endpoint Processor
The x86-based EP Processor is an AMD Athlon64 CPU with the nVidia nForce4 SLI chipset to support
the PCIe interface. Each x86-based PC connects to one down-stream port of the Multi-port PCIe switch via
the Non-transparent Bridge (NTB) port of the IDT PES24NT3 PCIe inter-domain switch.
The software is divided into three layers. The Function
Service layer is the top layer. It provides the device driver interface to the Linux kernel. The Message layer
is the middle layer. It encapsulates and decapsulates transport messages in a common format. The lowest
layer is the Transport layer. The Transport layer provides the service to send and receive data across the
PCIe interface and is hardware-dependent.
http://www.tairoa.org.tw/uploadfiles/file/journal/201212.pdf
http://www.rapidio.org/technology-comparisons/
http://www.plxtech.com/files/pdf/technical/expresslane/NTB_Brief_April-05.pdf
What is NTB (Non-Transparent Bridging)?
http://tofutu.blogspot.tw/2011/10/non-transparent-bridging-ntb.html
file://IDT_AN-571_APN_20080925.pdf
PXImc 介紹
http://www.ni.com/white-paper/12523/zht/
PEX8725, PCI Express Gen 3 Switch, 24 Lanes, 10 Ports
file:///Users/ben/Downloads/PEX8725_Product_Brief_v1.0_22Aug11.pdf
Virtual Ethernet over NTB
https://github.com/jonmason/ntb/wiki